The SAR is very useful tool to monitor CPU,memory,disk I/O,network resources all the time on Solaris server.But how do you analysis sar output ? Off-course you can use sar commands to see various system resource usage using sar output files.(Ex:Like sar -f file_name to see CPU usage,sar -r to see memory usage).But we are expecting more than this.In Solaris we do not have tool like NMON (AIX-Tools) to generate beautiful graphs.
But using KSAR you can achieve the same for Solaris SAR as well.
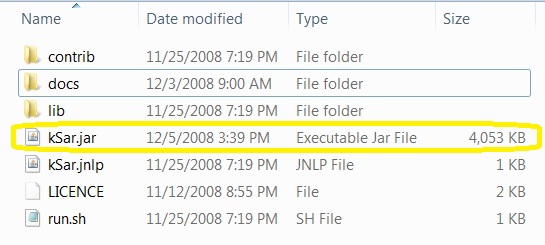
1.You can download KSAR and extract it in windows Box.
2.You need to convert the existing sar data file as text file using sar -A command.
But using KSAR you can achieve the same for Solaris SAR as well.
1.You can download KSAR and extract it in windows Box.
2.You need to convert the existing sar data file as text file using sar -A command.
# cd /var/adm/sa
# ls -lrt
total 392292
-rw-r--r--   1 sys      sys      11463168 Apr 21 23:00 sa21
-rw-r--r--   1 sys      sys      21015808 Apr 22 23:00 sa22
-rw-r--r--   1 sys      sys      21015808 Apr 23 23:00 sa23
-rw-r--r--   1 sys      sys      22166848 Apr 29 23:00 sa29
-rw-r--r--   1 sys      sys      8564464  Apr 30 10:40 sa30
# sar -A -f sa29 > sa29.txt
# ls -lrt |grep sa29.txt
-rw-r--r--   1 sys      sys      8564464  Apr 30 10:40 sa29.txt
3.Copy the sa29.txt to your windows laptop and execute the kSar.jar.
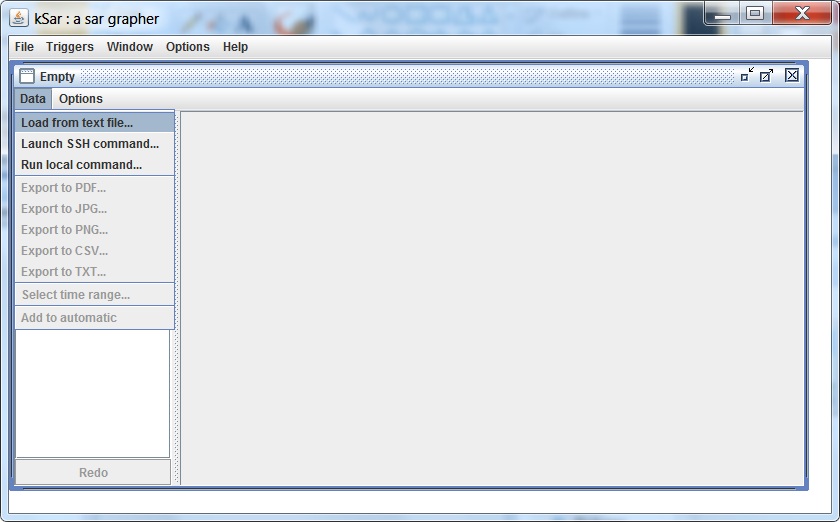
4.After executing the kSar.jar you will be getting the below screens.

5.To load the sa29.txt,
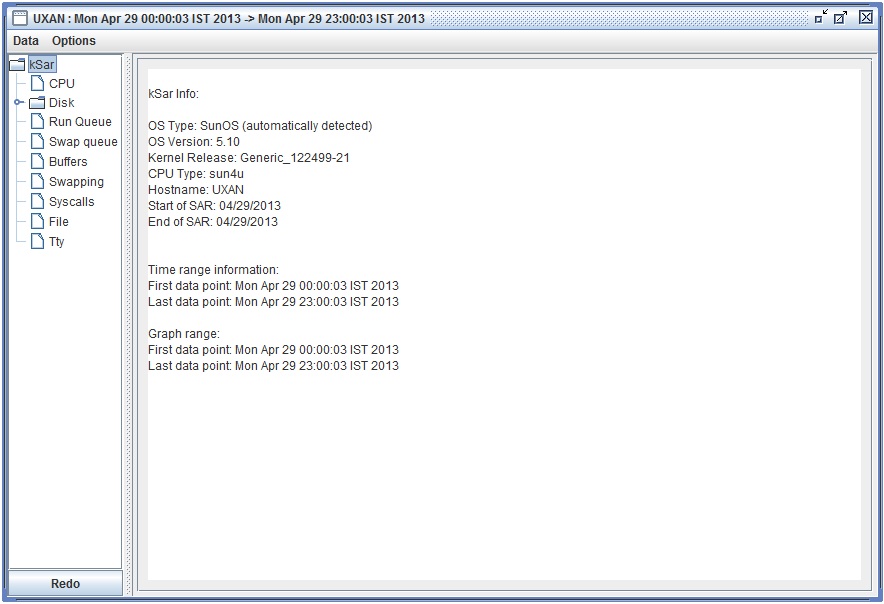
6.After loading the Sa29.txt file,you will get below screen.
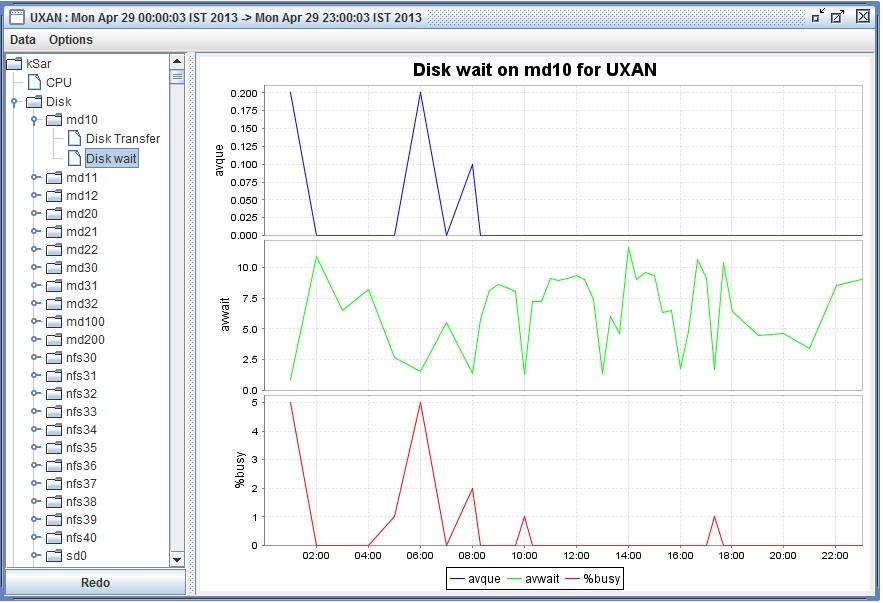
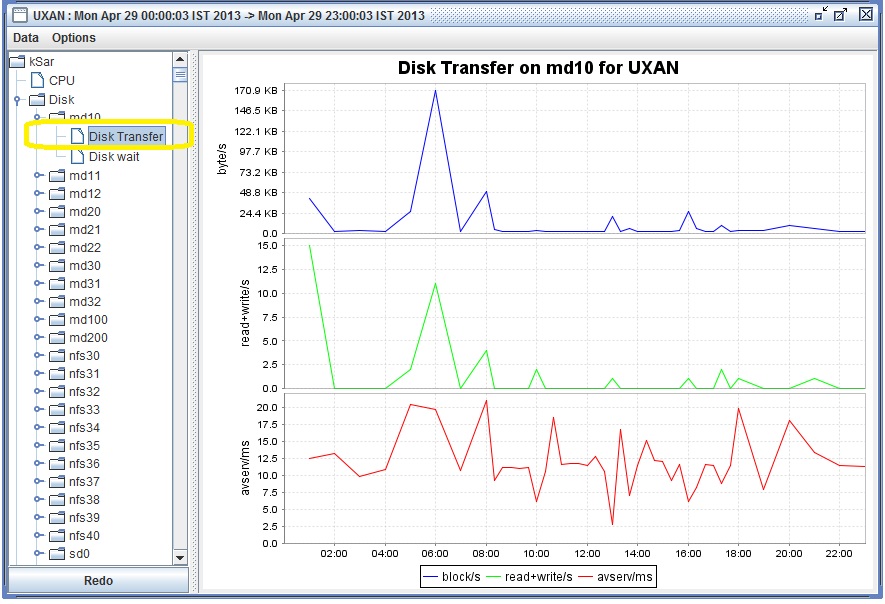
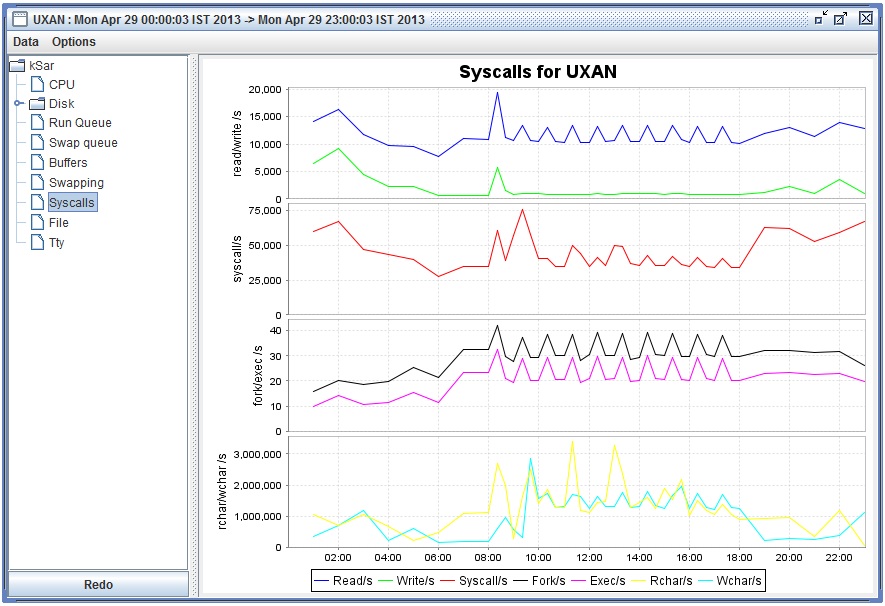
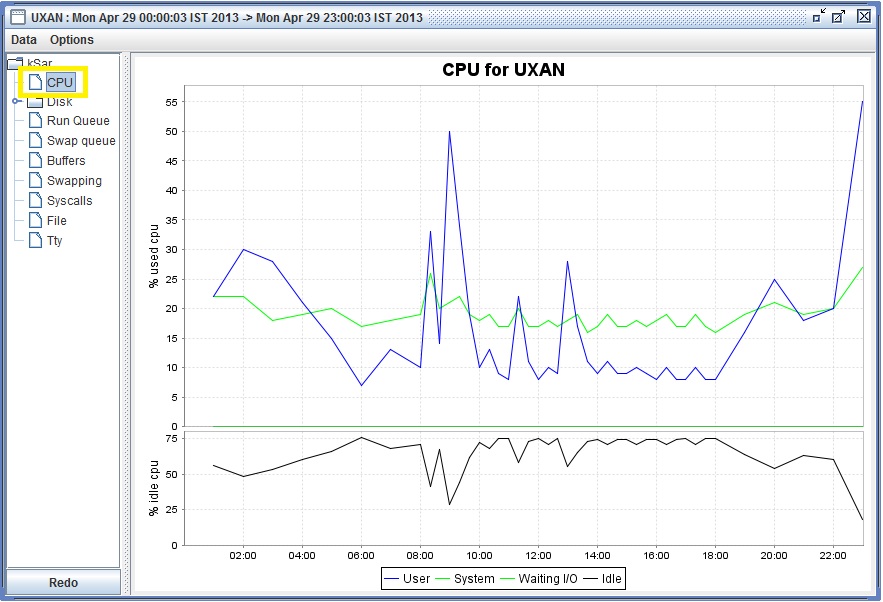
7.Now you can see some awesome graphs of sar file.

Thank you for reading this post.Please leave a comment if you have any doubt.I will get back to you.
James says
how do you refresh the report every 5mins and keep running it always
Lingeswaran R says
Thanks Rino…
Lingeswaran R says
you’re just missing the -f to specify the specific saXX file
so
sar -A -f sa30 > sa30.txt
Thanks to Rino